Custom Events
The Game Analytics API has options for custom events. The extra options give game developers a way to create custom charts. By collecting player data, games can be tested to make sure every level is possible to complete. Additionally, the difficultly can be finely tuned to ensure an enjoyable and compelling experience. This data driven workflow with games and level design is often called rational game design. The Analytics custom events can be used to create the player-developer feedback loop needed in rational game design.
Custom Chart Options
With Values (Comparative)
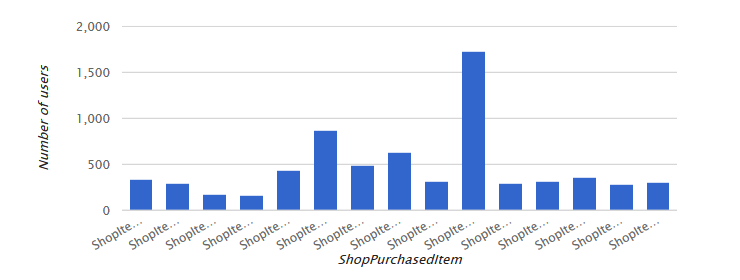
When a value is provided with a custom event, it will display a bar graph with comparative data. In the above example, it shows what items are most popular in a shop.
Without Values (Cumulative)
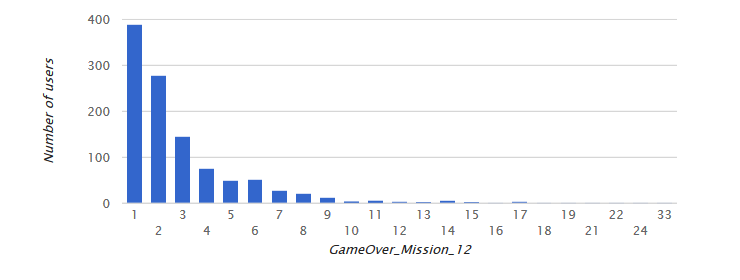
When only a custom event is tracked without a value provided, it shows user distribution. In the above example, it shows how many times players died while completing a particular level. Using valueless custom events requires the user_id property.
Additional Data
Below the raw events chart is a list shown that splits the data into ranges to display the distribution. This is useful if the raw events chart has many values and it is difficult to see overall trends.
Sending Data
Data can be sent using the HTTP methods POST or GET to the following address.
https://t.y8.com/log
Data can be sent in a address query string using GET, as json or form data using POST.
{
    event: 'custom',
    domain: 'monkeybeans.com',
    game_id: 'YOUR APP ID HERE',
    custom_event: {
    	name: 'Purchased Items',
    	value: 'Sniper rifle'
    },
    uuid: 'Blank on the first call, reused for following calls.',
    user_id: 'If pid is available, send it here.'
}
More API details are available at the Analytics API reference.